Monitoring in SonataFlow Dev UI extension
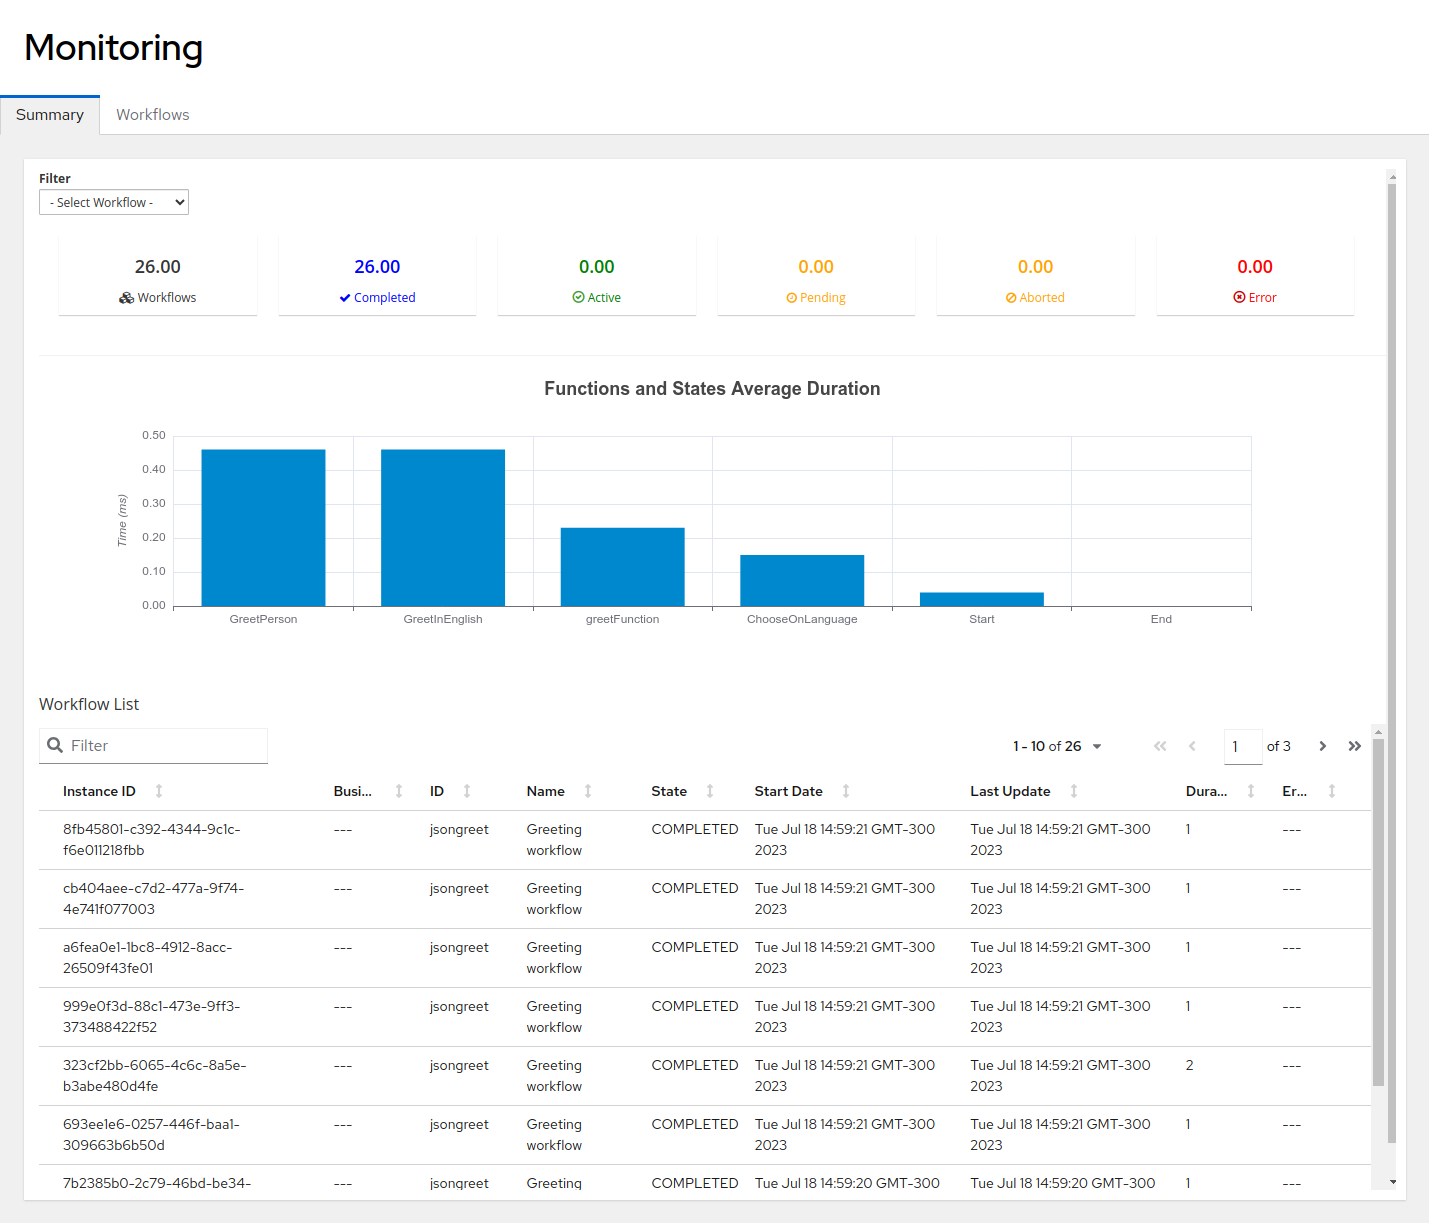
In the SonataFlow Dev UI extension, the Monitoring page displays default dashboards that might be useful while developing a workflow.

Figure 1. Monitoring Summary tab
In the Summary tab you will find the list of workflows with the following details:
-
Amount of workflows on each status.
-
Average time spent on each workflow state.
-
List of workflows executed and their details.
Viewing detailed information about the execution of workflow instances
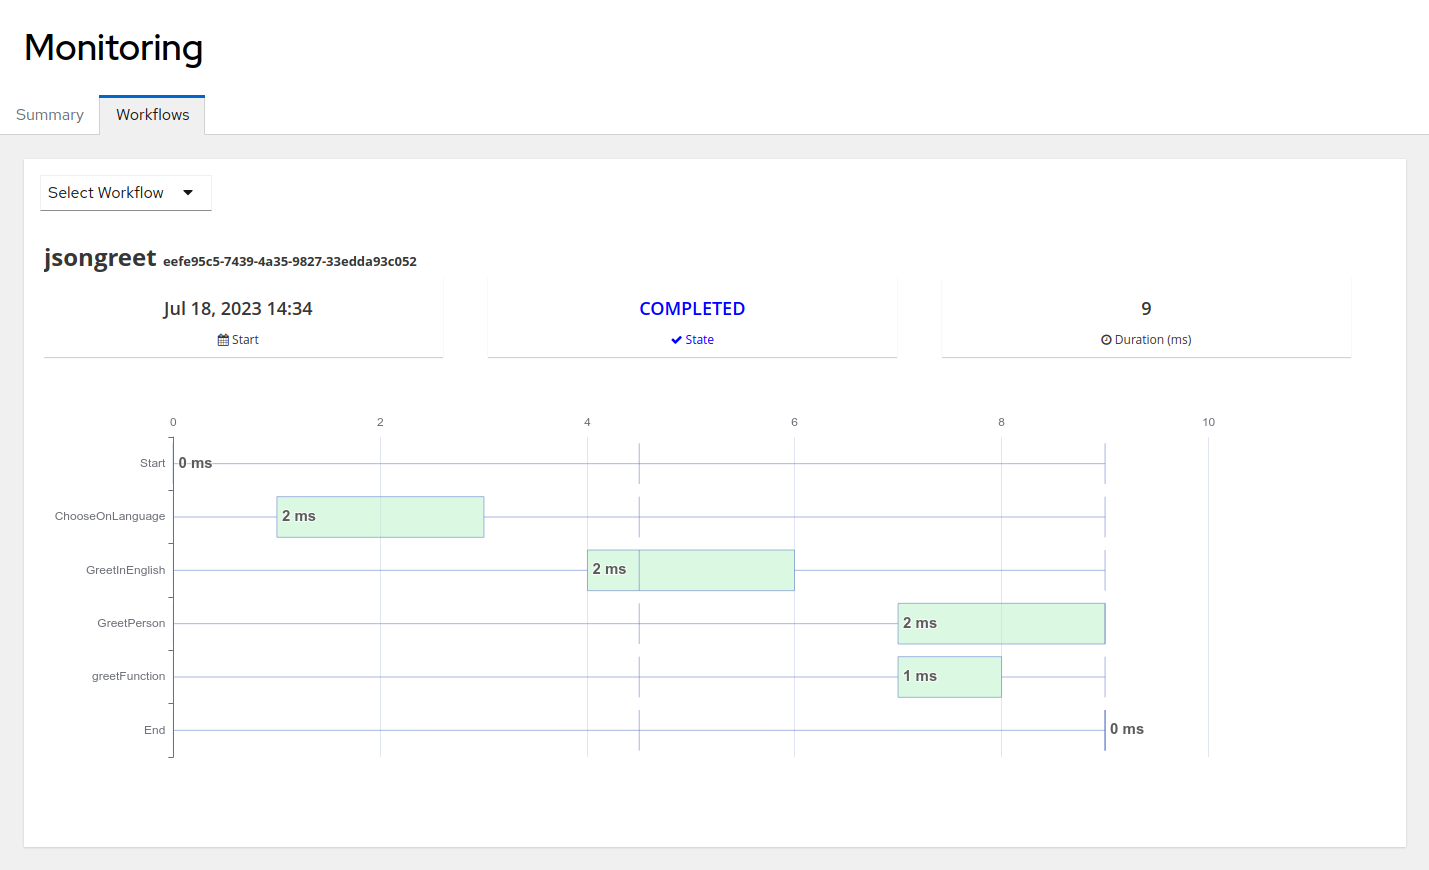
To view detailed information about a specific workflow instance execution, you can use the Workflows tab. In the Workflows tab, you can find details such as when the workflow started, its state, and how long its execution took. Also, you can check how much time was spent on each state.

Figure 2. Monitoring Workflows tab
Found an issue?
If you find an issue or any misleading information, please feel free to report it here. We really appreciate it!